FiReBuG ODE Simulation
The FiReBuG
random bit generator system is modeled using solutions of ordinary
differential equations (ODEs) that correspond to circuits that
represent some of the real world imperfections of a CMOS VLSI
realization.
Theory
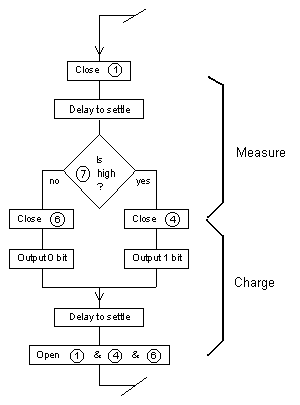 Two distinct parts of the FiReBuG cycle are
modeled: measure and charge (store). The parts of the cycle are shown in
this portion of the FiReBuG flowchart. During the measure part of the
cycle both capacitor voltages are relaxed toward their natural level by
leakage while the measuring circuitry stabilizes. During the charge
part of the cycle one capacitor (the measured one) continues to have
its voltage relaxed by leakage, while the other is charged toward one
of two potentials, based on the measurement and the simulated logic. Two distinct parts of the FiReBuG cycle are
modeled: measure and charge (store). The parts of the cycle are shown in
this portion of the FiReBuG flowchart. During the measure part of the
cycle both capacitor voltages are relaxed toward their natural level by
leakage while the measuring circuitry stabilizes. During the charge
part of the cycle one capacitor (the measured one) continues to have
its voltage relaxed by leakage, while the other is charged toward one
of two potentials, based on the measurement and the simulated logic.
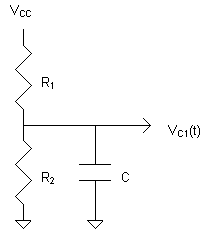 This circuit is used to model leakage of both
capacitors during the measure part of the cycle, and one capacitor
during the charge part of the cycle. The resistors relax the
capacitor's potential toward a central value near half of the supply
potential. It remains to be determined if this is the natural behavior
of a CMOS capacitor, or if resistors must be added to approximate this
cenering behavior. The charge centering is one of the mechanisms that
prevent the FiReBuG system from entering a lock-up state where it would
produce a constant stream of 0's or 1's. Nominal values for R1
and R2 of 2 MOhm were chosen for the simulation, but, based on
the results of the simulation, higher values (perhaps 10 MOhm) would be
acceptable. Higher values increase the information entropy in the
bitstream produced at the cost of an increased possibility of lock-up. This circuit is used to model leakage of both
capacitors during the measure part of the cycle, and one capacitor
during the charge part of the cycle. The resistors relax the
capacitor's potential toward a central value near half of the supply
potential. It remains to be determined if this is the natural behavior
of a CMOS capacitor, or if resistors must be added to approximate this
cenering behavior. The charge centering is one of the mechanisms that
prevent the FiReBuG system from entering a lock-up state where it would
produce a constant stream of 0's or 1's. Nominal values for R1
and R2 of 2 MOhm were chosen for the simulation, but, based on
the results of the simulation, higher values (perhaps 10 MOhm) would be
acceptable. Higher values increase the information entropy in the
bitstream produced at the cost of an increased possibility of lock-up.
The circuit's ODE can be written
by inspection: VC1(t)/R2 + (VC1(t)-VCC)/R1
+ C d VC1(t)/dt = 0
Which has the solution (using
Mathematica)
 These equations were used in the
simulation code.
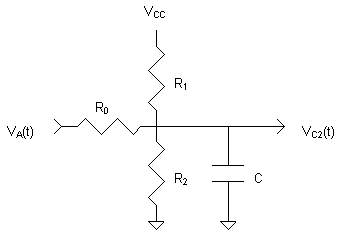 This circuit is used to model the capacitor
that is being charged. The leakage resistors are still present and the
charging potential VA(t) is applied through a resistor R0
to model a limitation on the input current. In the simulation a value of
3.3 kOhm was used to keep charging current below 1 mA in at all times.
In the CMOS realization, current limitation may be an inherent property
of the switching circuitry, or it may be explicitly included, either as
a current limiter or a resistor. The charging potential VA(t)
will be one of two possible values, depending on the VC1(0)
potential at the beginning of the Charge part of the cycle. Because VC1(t)
changes during Charge due to leakage, VA(t) changes also.
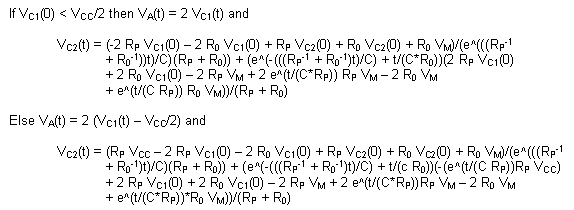
The circuit's ODE is again trivial, but its solution becomes quite
complex due to the time dependence of the input: This circuit is used to model the capacitor
that is being charged. The leakage resistors are still present and the
charging potential VA(t) is applied through a resistor R0
to model a limitation on the input current. In the simulation a value of
3.3 kOhm was used to keep charging current below 1 mA in at all times.
In the CMOS realization, current limitation may be an inherent property
of the switching circuitry, or it may be explicitly included, either as
a current limiter or a resistor. The charging potential VA(t)
will be one of two possible values, depending on the VC1(0)
potential at the beginning of the Charge part of the cycle. Because VC1(t)
changes during Charge due to leakage, VA(t) changes also.
The circuit's ODE is again trivial, but its solution becomes quite
complex due to the time dependence of the input:
Simulation
The FiReBuG system as modeled by the
ODE solution and appropriate timing and logic are simulated with the C
language program ode_sim.c. The parameters
used with this version of the simulation are
| Bits per Second |
107 |
| Portion of Cycle for
Measure |
0.4 |
| VCC |
1.8 V |
| C |
4 pF |
| R0 |
3.3 kOhm |
| R1 |
2 MOhm |
| R2 |
2 MOhm |
These parameters can be easily
changed in the program to explore different circuit realizations. The
program has settable options to produce either voltage traces through
the cycles, voltages at the end of each Charge, or just the random bits
that are produced by the generator. All will be explored here.
Results
The capacitor voltages traces were
recorded during simulation of 12 cycles of the FiReBuG system and the
results are plotted here.
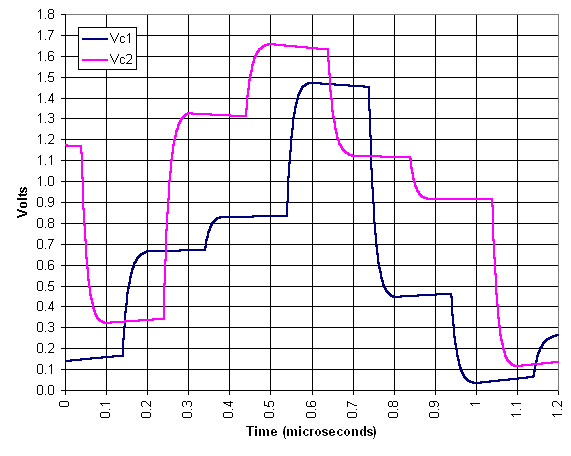 When a capacitor is not being
charged it exhibits a gentle slope (part of an exponential decay)
toward 0.9 V. When a capacitor is being charged it exhibits a rapid
exponential decay toward the target potential, either twice the other
capacitor's potential, or twice the other capacitor's potential less
0.9V. This is the expected behavior and gives confidence that the
simulation code is correct.
When the capacitor voltage at the
end of a Charge is plotted versus with the subsequent value for the
other capacitor over a simulation of 216 cycles a transition
map results.
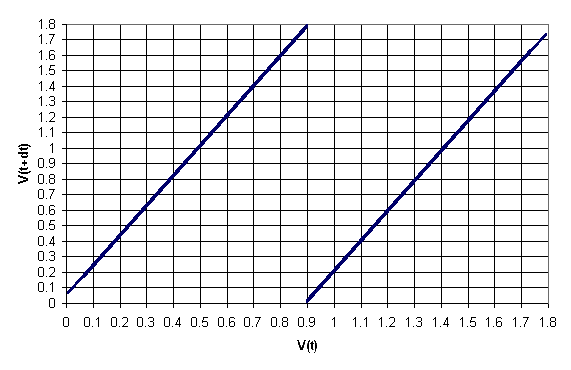 Again, this is the expected
behavior. Some evidence of the capacitor leakage can be seen at the
extremes.
The same 216 voltages
used to generate the transition map were used to generate a histogram.
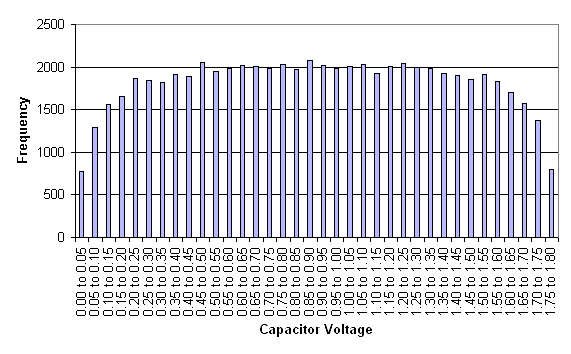 This shows good coverage of the
available charge range with some rounding at the edges due to leakage.
Here are some images of random
bits with 1's represented by white pixels and 0's as black pixels. An
equivalent image produced with output of a Blum-Blum-Shub (BBS) Pseudo
Random Number Generator (PRNG) is given for comparison. A BBS PRNG is
provably pseudo-random in an information theoretic sense.
 FiReBuG
 |
 Blum-Blum-Shub
 |
Click on the images for larger
versions. It can be seen that the bits produced by FiReBuG appear
smoother that those produced by BBS. This is a result of the capacitor
leakage centering effect that makes long runs of 0's or 1's unlikely.
There are no apparent patterns in either one however.
Another way to experience random
bits is to listen to sounds produced when the bits are treated as
samples and converted to audio signals. These files produce stereo sound
with 44,100 16-bit samples per second.

FiReBuG
(23 sec, 4 MB)
|

Blum-Blum-Shub
(23 sec, 4 MB)
|
These sounds have been listened to
using high quality speakers, and no difference is discernible to the
author.
Numerous statistical tests are
available for testing Random Bit Generators. The raw FiReBuG output can
be expected to fail many of these due to the capacitor leakage and
other lock-up prevention mechanisms. Leakage particularly has the
effect of preventing long runs of 0's (gaps) and 1's (blocks) and this
is very clear in a Runs Test (Handbook of Applied
Cryptography, 1996). Here are the results of a runs test on 225
bits produced by the simulation code:
File: ode_sim_bits.bin, 4194304
bytes
Longest Gap=10 Block=10
x4=784911.306904 px4=0.000000
|
Run Length
|
Expected Count
|
Gap Count
|
Block Count
|
|
1
|
4194304
|
4814956
|
4816240
|
|
2
|
2097152
|
2453271
|
2450446
|
|
3
|
1048576
|
1222672
|
1222681
|
|
4
|
524288
|
566297
|
567370
|
|
5
|
262144
|
144973
|
145626
|
|
6
|
131072
|
45694
|
45374
|
|
7
|
65536
|
13492
|
13623
|
|
8
|
32768
|
3049
|
3069
|
|
9
|
16384
|
365
|
345
|
|
10
|
8192
|
29
|
24
|
|
11
|
4096
|
0
|
0
|
|
12
|
2048
|
0
|
0
|
|
13
|
1024
|
0
|
0
|
|
14
|
512
|
0
|
0
|
|
15
|
256
|
0
|
0
|
|
16
|
128
|
0
|
0
|
|
17
|
64
|
0
|
0
|
|
18
|
32
|
0
|
0
|
|
19
|
16
|
0
|
0
|
|
20
|
8
|
0
|
0
|
|
> 20
|
8
|
0
|
0
|
There are less long runs that
expected and consequently more short runs of both 0's and 1's. This
results in less that full entropy in the raw bitstream. An estimate of
7.78 bits of entropy per byte of data was obtained using the public
domain ENT program.
A body of theory and practice is
available for condensing less-than-full-entropy streams into
full-entropy streams. A common example is the /dev/random mechanism in
Linux which uses an entropy pool into which data is stirred, and out of
which full-entropy random bits are extracted by way of a cryptographic
hash function. Such a method could be used in conjunction with FiReBuG
if a statistically perfect bitstream is desired.
Copyright (C)
2001 APA Consulting, a sole proprietorship of A. Peter Allan. All
Rights Reserved. Confidential.
|
 Two distinct parts of the FiReBuG cycle are
modeled: measure and charge (store). The parts of the cycle are shown in
this portion of the FiReBuG flowchart. During the measure part of the
cycle both capacitor voltages are relaxed toward their natural level by
leakage while the measuring circuitry stabilizes. During the charge
part of the cycle one capacitor (the measured one) continues to have
its voltage relaxed by leakage, while the other is charged toward one
of two potentials, based on the measurement and the simulated logic.


 This circuit is used to model leakage of both
capacitors during the measure part of the cycle, and one capacitor
during the charge part of the cycle. The resistors relax the
capacitor's potential toward a central value near half of the supply
potential. It remains to be determined if this is the natural behavior
of a CMOS capacitor, or if resistors must be added to approximate this
cenering behavior. The charge centering is one of the mechanisms that
prevent the FiReBuG system from entering a lock-up state where it would
produce a constant stream of 0's or 1's. Nominal values for R1
and R2 of 2 MOhm were chosen for the simulation, but, based on
the results of the simulation, higher values (perhaps 10 MOhm) would be
acceptable. Higher values increase the information entropy in the
bitstream produced at the cost of an increased possibility of lock-up.
 This circuit is used to model the capacitor
that is being charged. The leakage resistors are still present and the
charging potential VA(t) is applied through a resistor R0
to model a limitation on the input current. In the simulation a value of
3.3 kOhm was used to keep charging current below 1 mA in at all times.
In the CMOS realization, current limitation may be an inherent property
of the switching circuitry, or it may be explicitly included, either as
a current limiter or a resistor. The charging potential VA(t)
will be one of two possible values, depending on the VC1(0)
potential at the beginning of the Charge part of the cycle. Because VC1(t)
changes during Charge due to leakage, VA(t) changes also.
The circuit's ODE is again trivial, but its solution becomes quite
complex due to the time dependence of the input: